Because Conversations and Tickets seem to have different data sets. I want to create a very simple report that says:
> Show me where Agent A, has uniquely closed X number of Tickets & Conversations.
I want this on a dashboard.
How do I accomplish this? Because when I try to make it, I can very obviously see there is a large(not a trivial one) divide between the counts of “Resolved Tickets”, “Closed Conversations”, and “First Closed Conversations”.
I just want it under a single umbrella without having to make 3 unique reports. Is this possible?
Best answer by bernice
Hi @David | io.net 👋 To create a single report with multiple data-sets in Intercom, you can create a custom report. To do this, go to the Reports page and click the + icon or go to My reports and click on New Custom report.
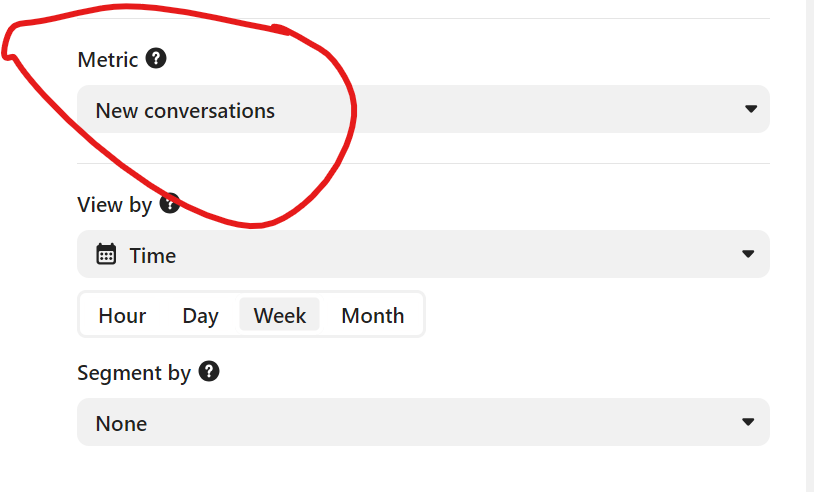
From there, you can design your first chart - select the metric and segment you want to display, save and close the chart and then you can click + Add New Chart to add another chart to the same report. Repeat this process for each data-set you want to include in the report. You can add multiple charts to the same report, and they will all be displayed together. This allows you to display multiple data-sets in a single report.
You'll find more on this in this article from our Help Center ⬇️
Hi @David | io.net 👋 To create a single report with multiple data-sets in Intercom, you can create a custom report. To do this, go to the Reports page and click the + icon or go to My reports and click on New Custom report.
From there, you can design your first chart - select the metric and segment you want to display, save and close the chart and then you can click + Add New Chart to add another chart to the same report. Repeat this process for each data-set you want to include in the report. You can add multiple charts to the same report, and they will all be displayed together. This allows you to display multiple data-sets in a single report.
You'll find more on this in this article from our Help Center ⬇️