Hey there @HugoRm, Emily from Support Engineering at Intercom here 👋🏼
You can get this with a single custom chart by counting closed conversations and then filtering that count into three “reply-count buckets.”
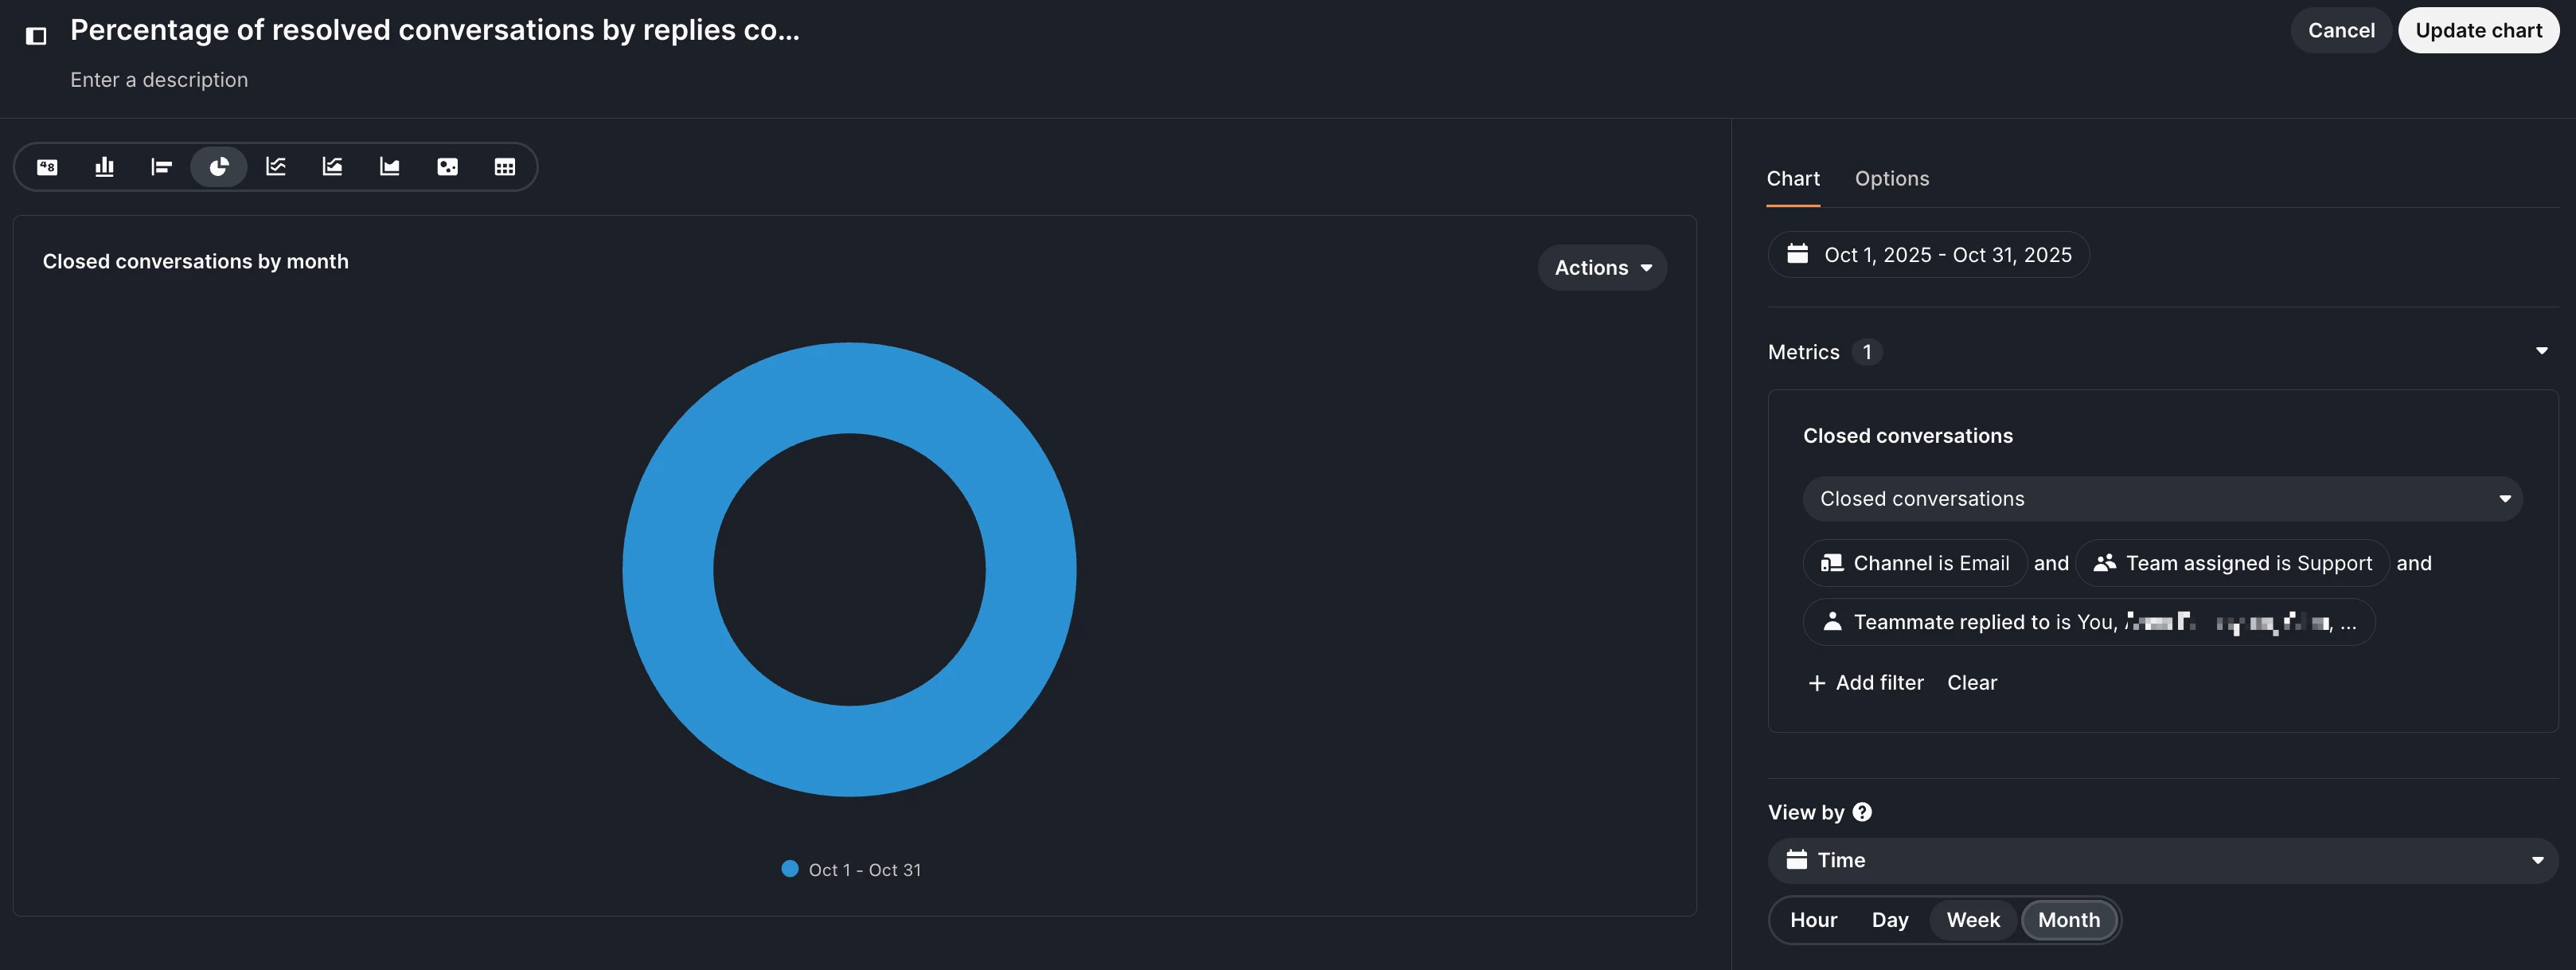
Chart setup
-
Open Custom report > Add chart. Pick Donut (single-period share) or Stacked 100% (trend).
-
Metric: Closed conversations (counts unique conversations, anchored by close time).
-
Add three series (all use Closed conversations) filtered by the attribute Replies to close a conversation:
-
= 1 (1 reply).
-
= 2 (2 replies).
-
≥ 3 (3+ replies).
Note: Replies are grouped (multiple back-to-back teammate messages before a customer reply count as one), so “1 reply” means one teammate reply cycle. Use Drill-in to export counts if needed.
Donut will show the distribution (share) across 1, 2, and 3+ replies for the selected date range; Stacked 100% columns will show the share over time. The total counts for each bucket are shown in the legend/tooltip and export.
Why not other metrics
-
“Replies to close” as a metric is for aggregates (mean/median/sum) and is anchored to conversation start, not ideal for bucketed counts by close date.
-
“Resolved on first contact” measures one-teammate involvement, not “closed in exactly one reply.”
Notes and gotchas
-
“Closed conversations” counts unique conversations closed in the range (a conversation can be closed multiple times, but the metric counts unique conversations filtered by when they were closed).
-
The Replies to close a conversation attribute counts replies with grouping: if a teammate sends multiple messages back-to-back before a customer replies, they count as one reply toward the total to close. This ensures “1 reply” truly means one teammate reply cycle before close.
-
If you prefer to download the underlying counts and do your own % math, you can use Drill-in on the chart and export to CSV from the chart actions menu.
Hope this helps a little Hugo! 🙏🏻