

Aggregated Customer Experience (CX) rating explanations | Community
Skip to main content
Submitted

Aggregated Customer Experience (CX) rating explanations

Related products:Reporting
  • June 3, 2025
  • 6 replies
  • 60 views

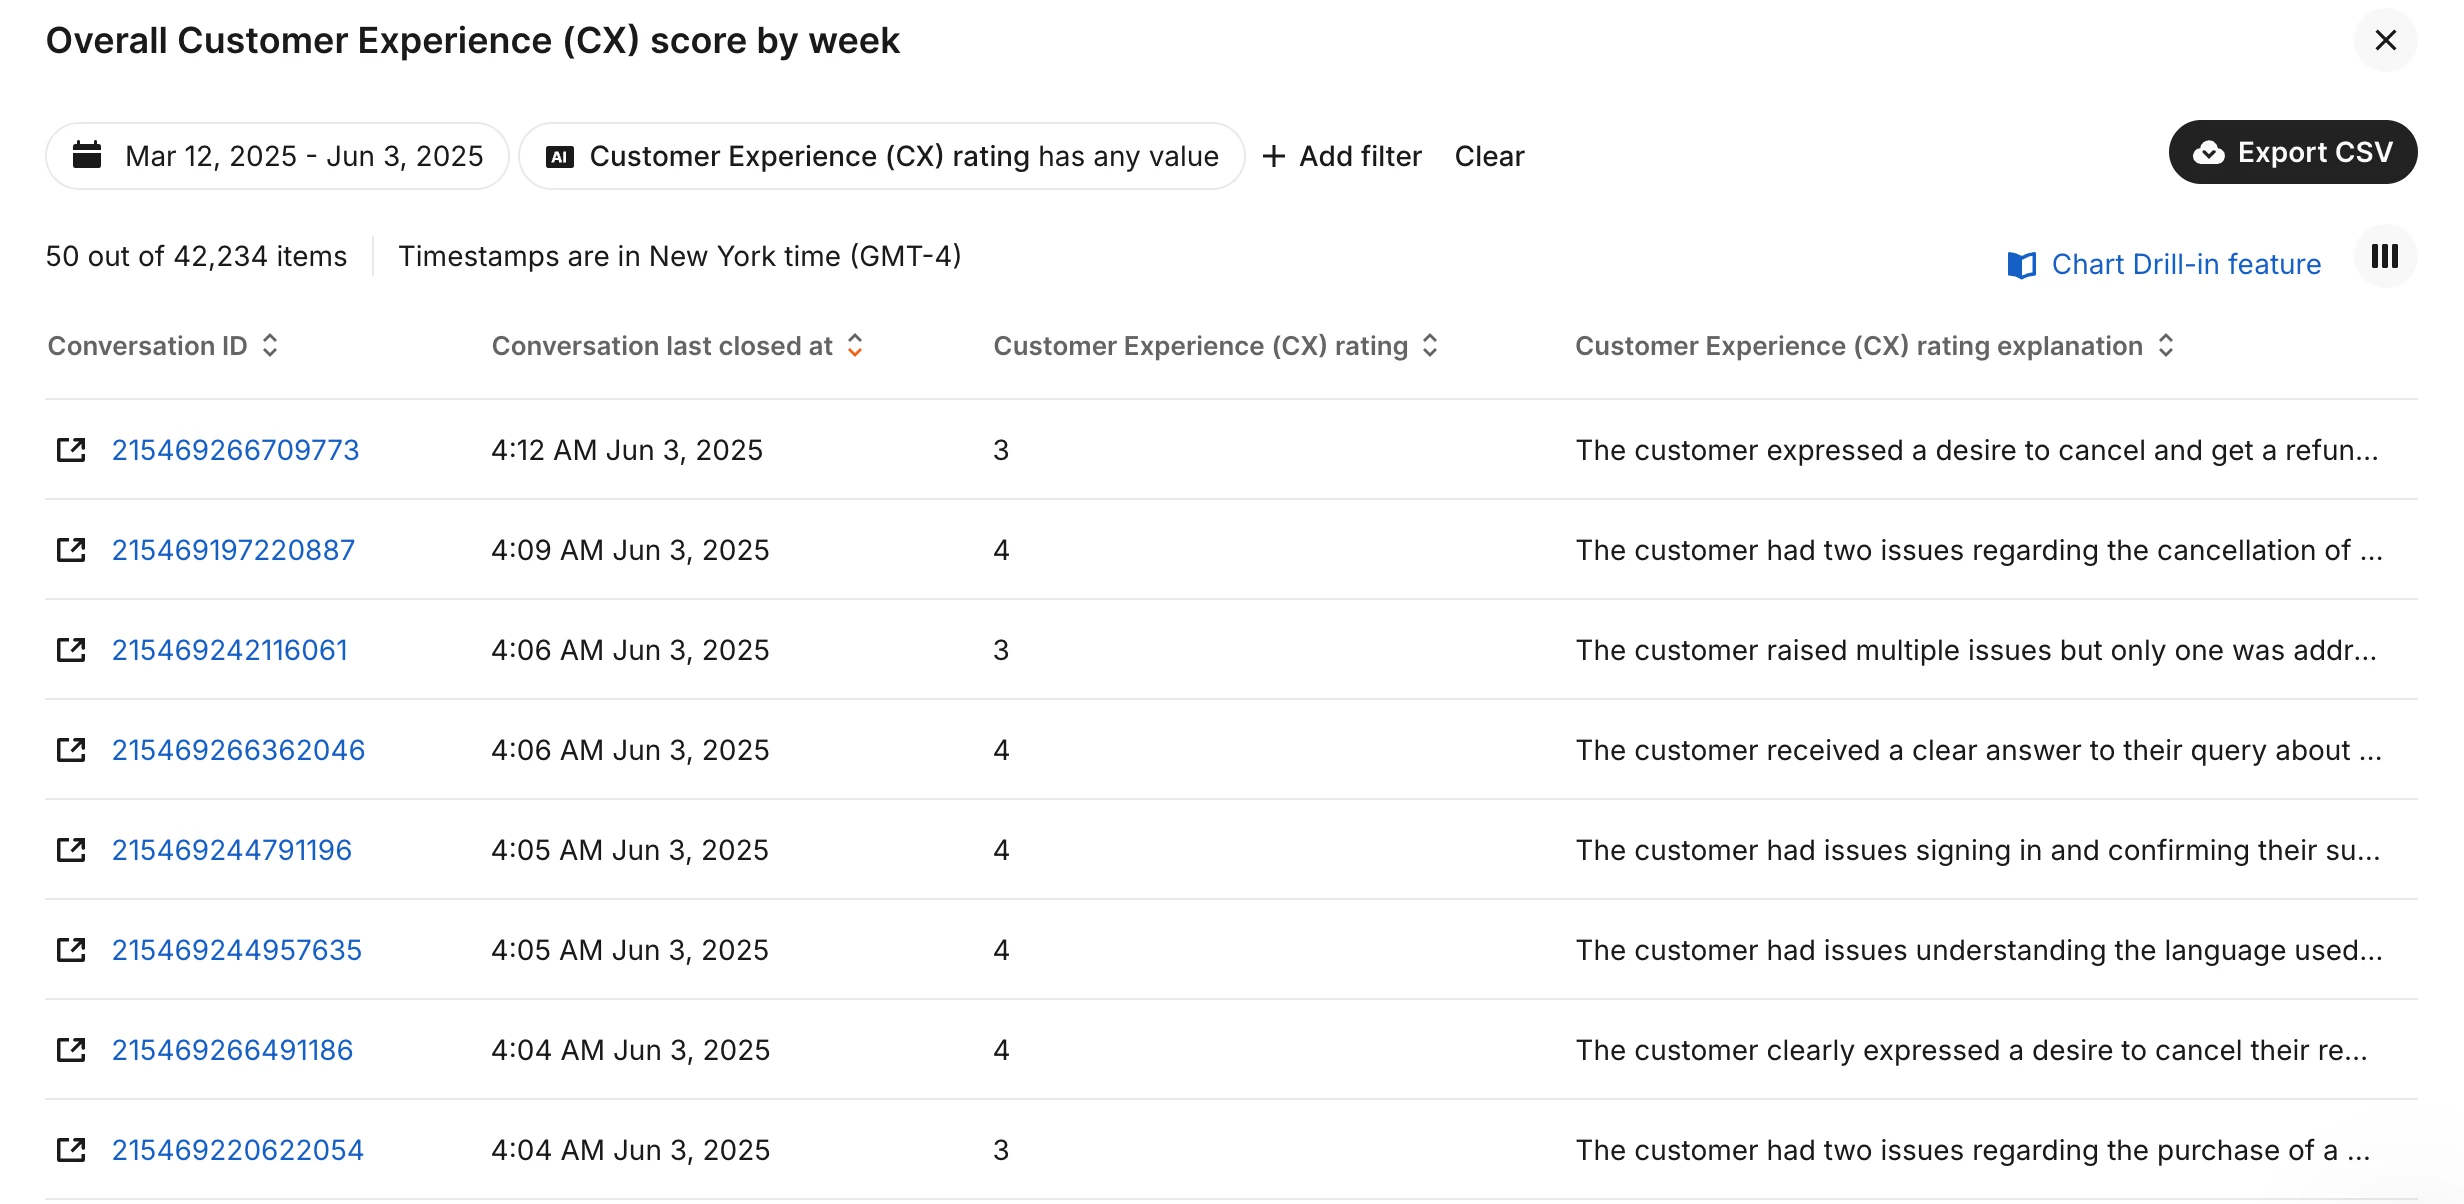
Would love to see an aggregated AI summary of the CX score that gives rationale for what changed over time, or for any given timeframe. Right now when you drill into the CX chart, there’s an explanation for the CX rating for each conversation, but going over each conversation one-by-one is very cumbersome & won’t easily show the reason for a peak/dip. 

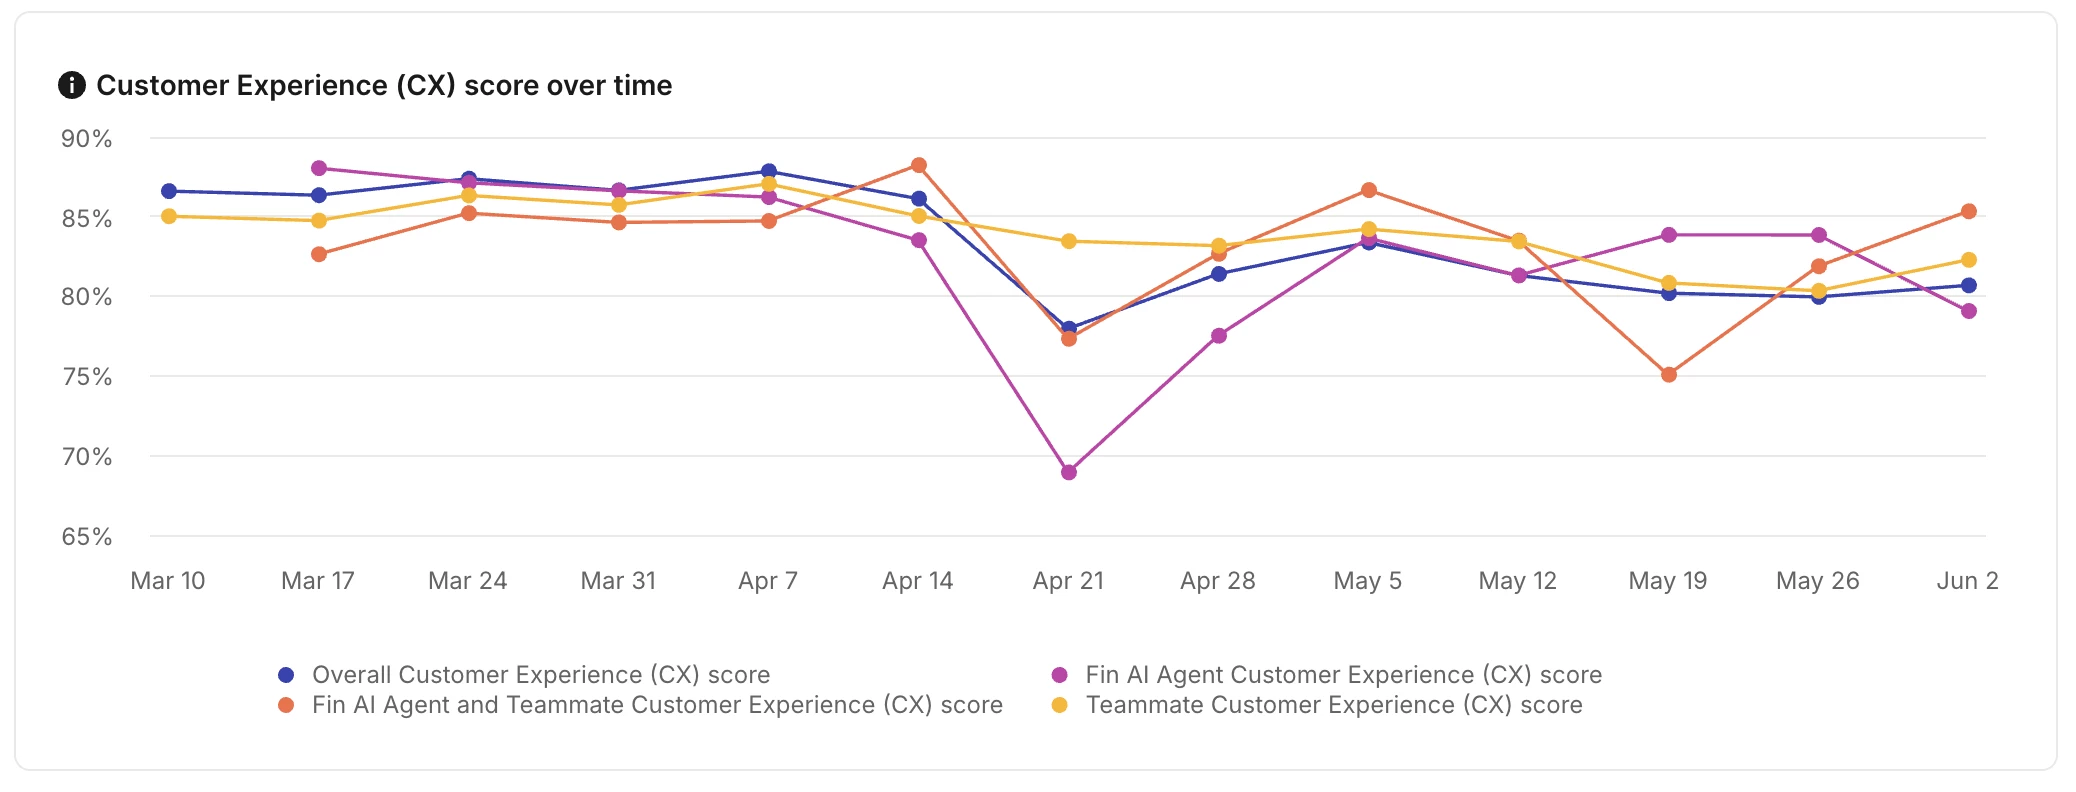
The new topics explorer is a start, as you do see how the CX score changes per topic over time, but it still doesn’t explain why the experience changed. To understand this, you still need to read each conversation one-by-one. An aggregated summary of the CX rating explanations (overall and/or broken down by topic) would be a great addition to these features.

As a workaround for now, I exported the drill-in CX score report and asked ChatGPT to summarize the week-by-week explanations and help us to understand what’s changing over time. 


6 replies

Conor
Super User ✨
Forum|alt.badge.img+5
  • Super User ✨
  • June 3, 2025

Ah, that’s an interesting idea ​@Debra, thanks for writing it down! 

In the meantime, could you share the prompt that you used in ChatGPT? I’d love to give that a test! 


  • Author
  • New Participant
  • June 3, 2025

Sure! My prompt involved a few steps, you can of course combine these into one longer prompt. I ended up repeating these steps 3 times for each of the types of CX score, and at the very end I asked for an overall summary.


Here are my main prompts:

Initial prompt:

Intercom have a new 'customer experience' metric and we can see that it's been decreasing over time for Simply Piano conversations in particular. I am attaching a screenshot of the data showing the downward trend, and I am also attaching a download which contains a Customer Experience (CX) rating explanation for each conversation. Can you can analyze the comments in the data ('Customer Experience (CX) rating explanation' column) to understand why it decreased? There is a date stamp so you can see when the conversation was closed.

» It then gave me a weekly breakdown of the customer comments associated with their CX ratings.

Follow up prompt #1:


Please now analyze the weekly breakdown to identify trends and categorize issues (e.g. tone, delay, resolution quality, etc).

» It gave me a categorized summary of the CX feedback comments, showing the most common themes customers mentioned.

Follow up prompt #2:

I’d now like a week-by-week breakdown of all the categories to see how they’ve changed over time, please show this as a line graph and summarize the key take-aways / recommendations.

» Got my line graph and key take aways :)

Follow up prompt #3:

Could you give me a summary of what sorts of things you've categorized as "other", and re-analyze those to suggest new potential categories, including a new line graph of these new categories?


It was really insightful in the end, and showed us our strengths, as well as actionable ways we can improve going forward. Hope this helps!


Conor
Super User ✨
Forum|alt.badge.img+5
  • Super User ✨
  • June 4, 2025

That’s very cool, thanks Debra! May I share a link to this with my daily email list subscribers? I think it will help other Intercom leaders see patterns over time and work out what steps to take next


  • Author
  • New Participant
  • June 9, 2025

Yes sure!


Hey Folks, 


I just posted a demo on linkedin about how we are looking to handle this use case right within the product. 

Check it out and let me know what you think! Happy to connect and talk through this as well.


Mark


  • Author
  • New Participant
  • July 29, 2025

Thanks for sharing this Mark! Adding an in-depth summary for each topic is a great step forward. Do you have any plans to be able to take it a step further and analyze what changed over time, to explain increases/decreases in the scores? E.g. In X week there was a bug that Fin didn’t know how to answer, which is why the CX score dropped. Looks like a workaround would be to compare the summary for two different timeframes.